Loading tables ...
It might take a minute or so to load and sort the entire dataset. If you do not see the tables after a while, please try a different broswer.
Browsers supported: Chrome, Arc, Firefox, and Edge (C-A-F-E)
Safari is NOT currently
supported.

Overview
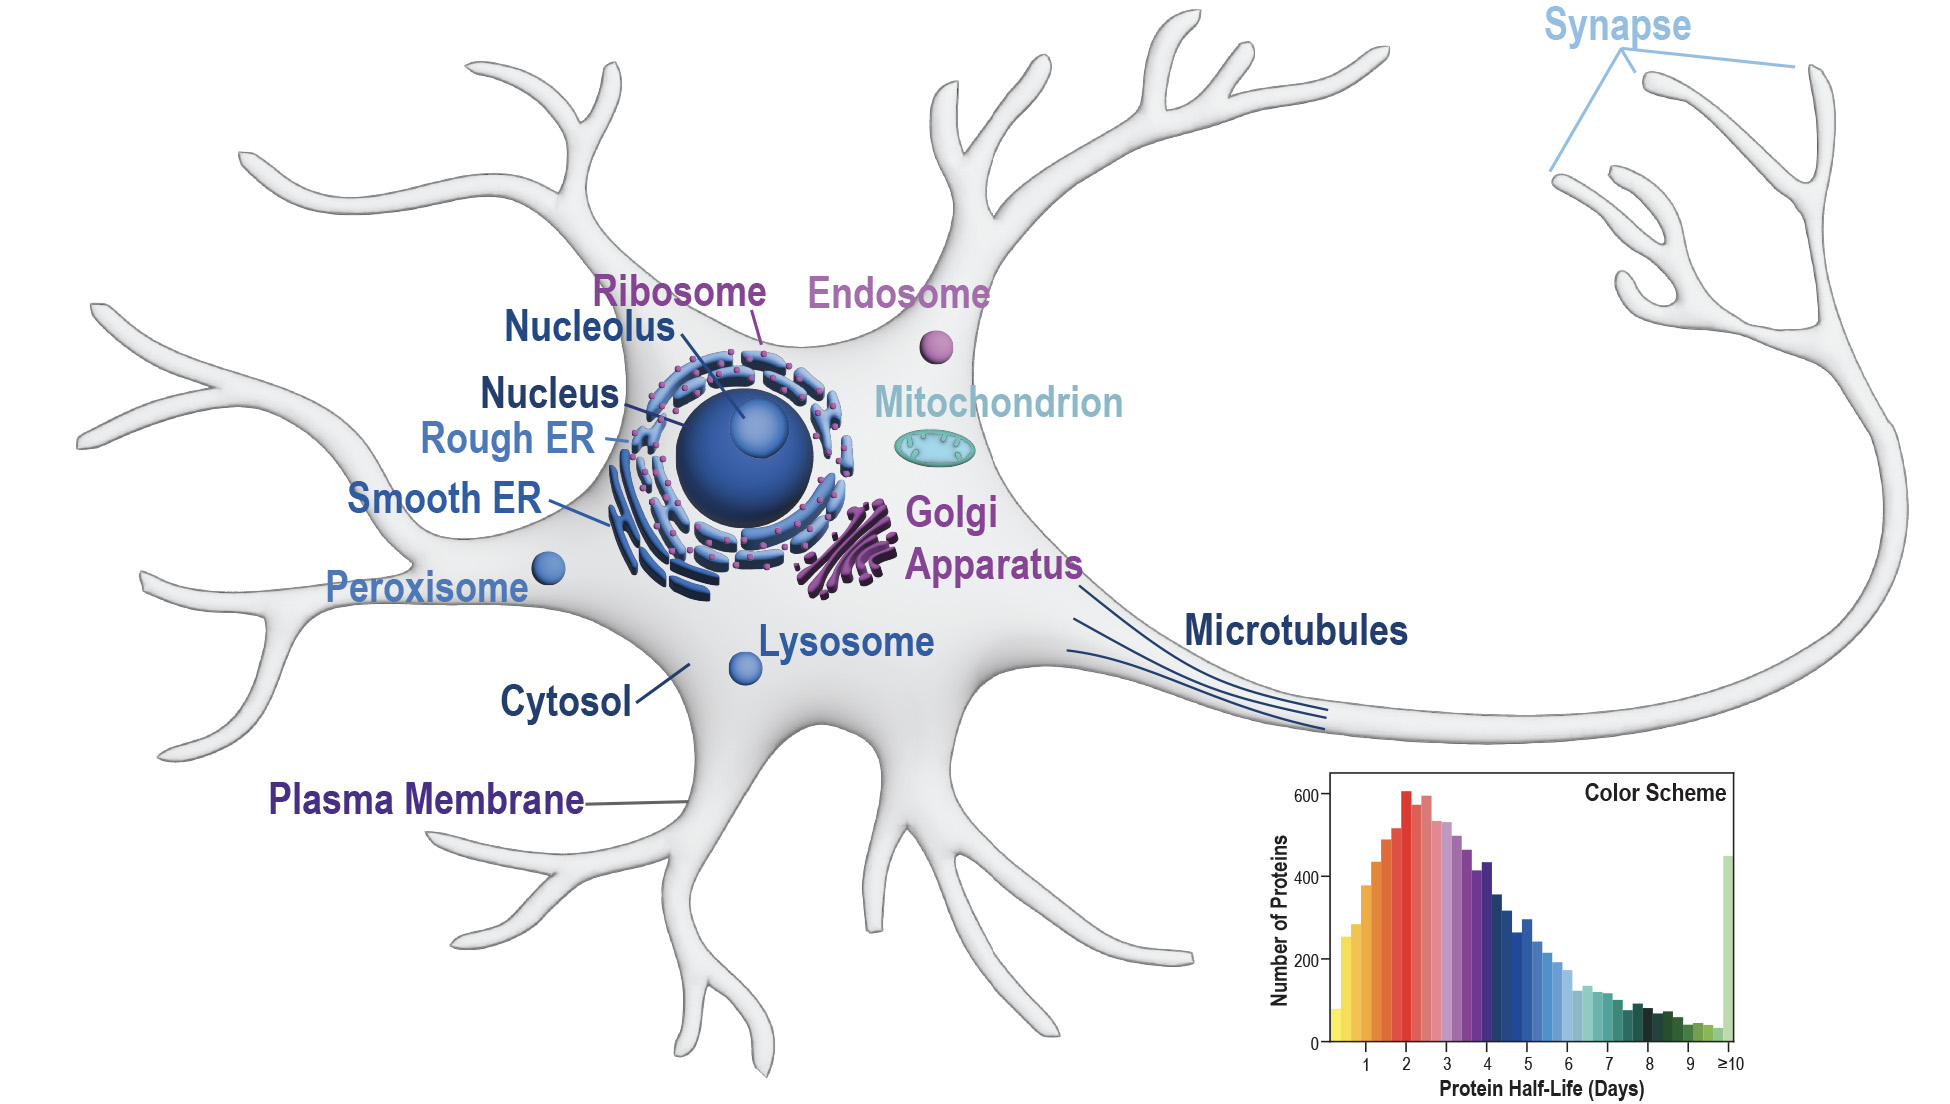
Neuron protein half-lives are measured using the dynamic Stable Isotope Labeling in Cell Culture (dSILAC) coupled with bottom-up proteomics technique. This dataset measured the half-lives of a total of 10,792 proteins and 162,854 peptides from human iPSC-derived neurons.

Curve Fitting
Human iPSC-derived neurons were harvested at 1,2,4,6 days after switching to the heavy amino acid-containing medium. Relative abundances of light peptides were modeled using exponential decay curves, and peptide half-lives were determined through curve fitting. Protein half-lives were calculated based on all unique peptides associated with each protein.
